
Several weeks ago, I was sitting on the couch at my girlfriend’s house, trying to pay attention both to the conversation taking place around me and to the Phillies vs. Padres game on the TV in front of me. As nothing happening in the game was particularly captivating, I was mostly giving the screen only an occasional glance, just making sure I didn’t miss anything major. The Padres had a 3-2 lead going into the bottom of the 9th, so I knew to expect a pitching change as they called upon their closer. Suddenly, I fell into a kind of trance. The screen had become riveting, so much so that I couldn’t tear my eyes from it. My girlfriend asked me if I was okay, snapping me out of the hypnotic state. Yes, I was okay; but I was also completely blown away. I had seen Kirby Yates’s numbers.
I had known that Yates was a very good relief pitcher. He had had an excellent season in 2018 and was deservedly named an All Star in 2019. The numbers were still ridiculous. First of all was the ERA. Among all pitchers with 30 IP he ranks first in ERA with a minuscule 1.25. To insert the context that’s an ERA+ of 343 (!) and an ERA- of 29 (!!).
While it usually provides at least a decent frame of reference, just looking at ERA for a relief pitcher isn’t the smartest method of evaluation. How about FIP? Let’s sort the MLB FIP leaderboard, set the minimum IP to 30, and check the results. Oh. Yates is first again. His FIP is 1.27. The FIP- is 28. He looks even better by FIP than he did for ERA.
Let’s look at some other measures. xFIP leaderboard and sort. Well now Yates has fallen all the way to *checks notes*, ah yes, first again, with a 2.17, and a 48 xFIP-. K-BB% he ranks second (36.4%). K/9 he’s fifth (14.98). K/BB, second (8.00). WHIP – a more crude measure, I know, but still very impressive – eighth (0.90). Even his DRA is first among relief pitchers at 2.03 (41.6 DRA-).
The question then becomes, how exactly does Yates do this? A quick look at his Statcast numbers shows him to be elite in all of the expected statistics (xBA, xSLG, xwOBA), ranking in the 99th, 100th, and 100th percentiles, respectively. Yet at the same time, one can see that Yates’s fastball isn’t anything remarkable. It rates in only the 57th percentile of velocity and 61st of spin rate. On a per pitch basis this fastball ranks 40th among relievers. Vertically, it has averaged 8.13 inches of movement, with -7.68 inches horizontally. It is certainly a good pitch, but doesn’t seem to imply the unholy dominance of Yates.
Of course, the fastball isn’t Yates’s only offering. He also has a splitter that he throws about 42% of the time. In 2019 this pitch has averaged -0.35 inches of vertical break, and -7.35 horizontally. It has been the 7th most valuable splitter among relievers pitch for pitch, and first in total value. Batters have managed only a .152 AVG and .179 SLG against this pitch, with a .179 wOBA and an even more impressive .199 xwOBA. This appears to mostly be because of an average launch angle of -1 degrees against the splitter. The break and spin rate on this pitch, however, don’t quite align again with the elite results. So the question remains, how has Yates been so incredible?
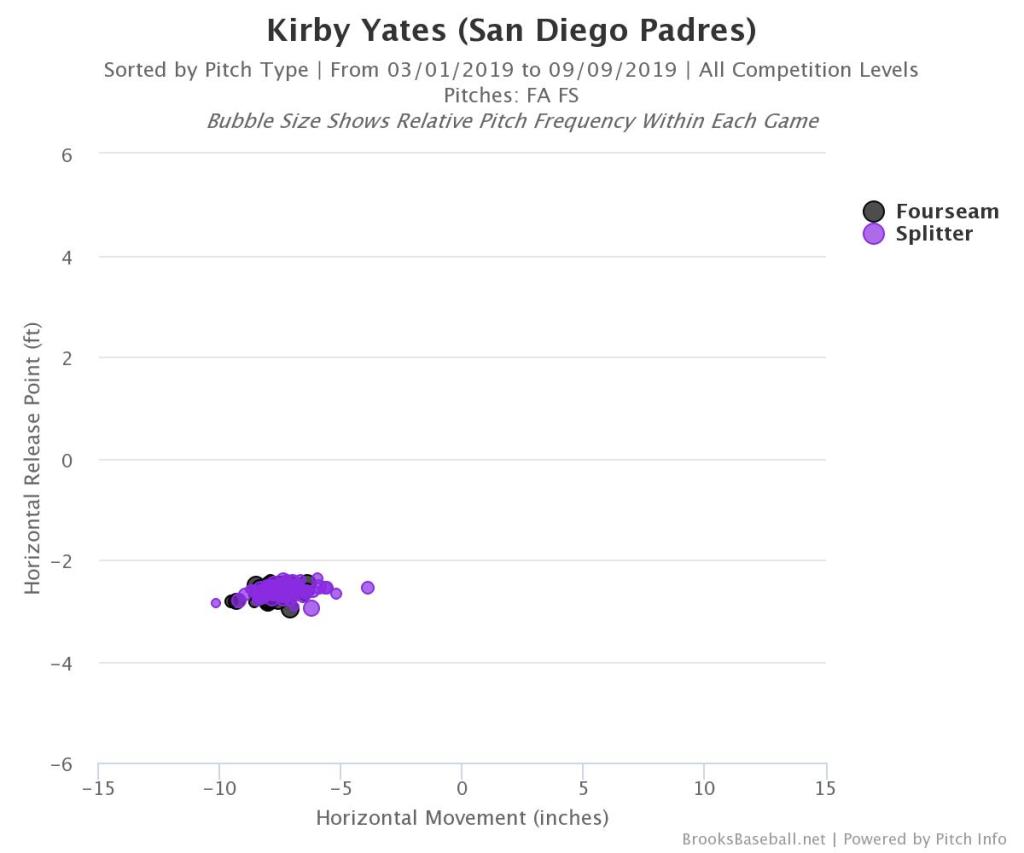
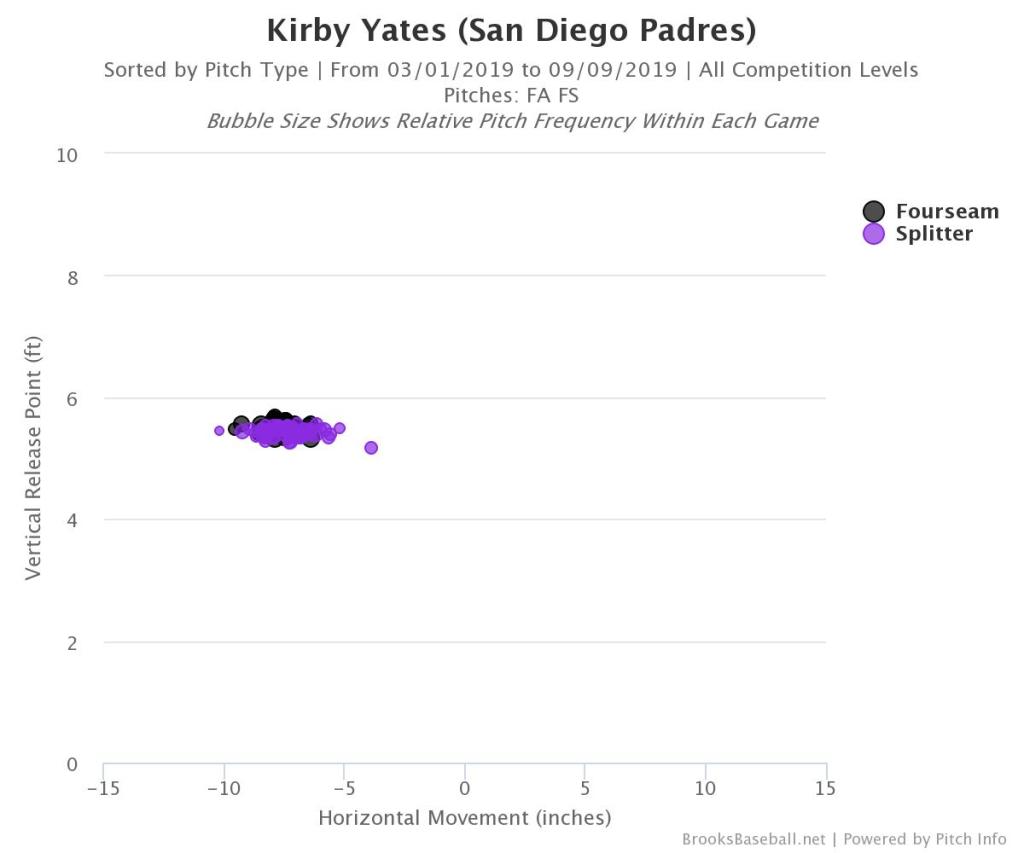
Well there’s our explanation. Yates’s fastball and splitter have come from an essentially identical release point. He throws them a similar amount of the time, and the batter now would have loads of difficulty determining which pitch is which. This can easily lead to the two pitches tunneling like this:
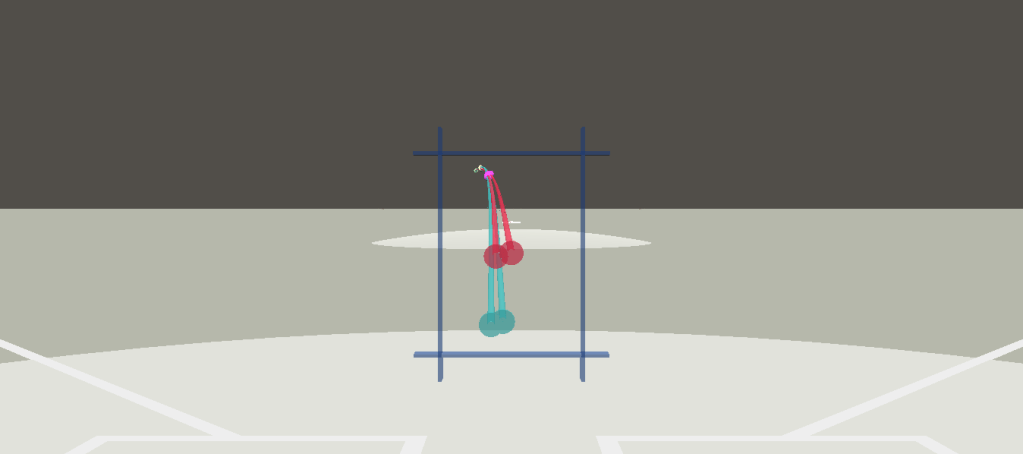
The pink marks represent the reaction point for a hitter. At that reaction point, the fastball and splitter are still traveling along paths indistinguishable from each other. It’s clear why hitters would be guessing so much against Kirby Yates; release points and pitch tunneling have paved the way for his astounding 2019.
